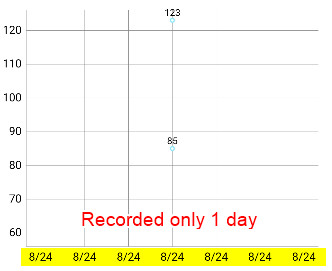
The graph will only display one day or a few days at first, until enough measurement days have accumulated.
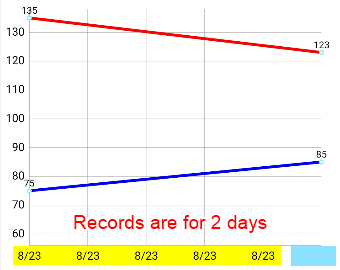
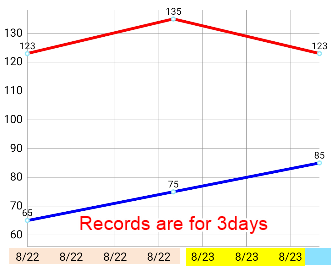
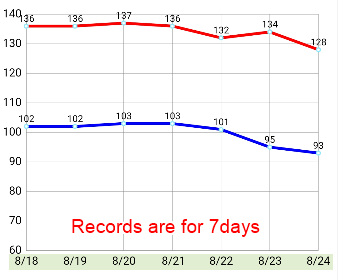
As more records are added, each division will represent one day.
*Dates that are hidden can be displayed by spreading 2 fingers apart on the graph.
If the graph display is still incorrect
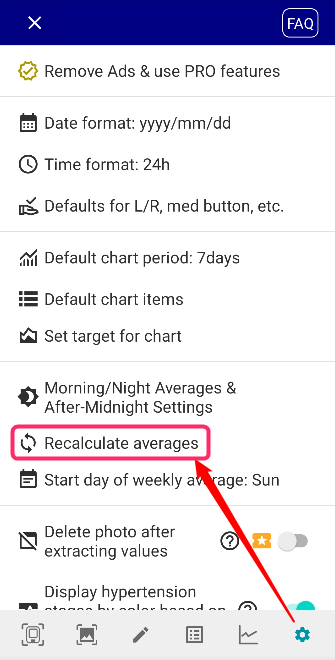
Settings → Recalculate Averages to fix the issue.